i4Q- Analytics Dashboard
General Description
i4QAD is a reporting interface that allows monitoring industrial data with fully flexible visualisation drill-down charts and a flexible dashboard to provide meaningful analytics to users on a real-time basis using incremental algorithms. This i4Q solution provides a graphical interface where it is possible to visualise any kind of Data and/or other types of information provided by other solutions.
This solution has the main function of providing visual analytics tools and methods to the i4Q project. The i4Q Analytics Dashboard can be used via a Web Application or through the provision of a deployment bundle that can be deployed on-premises or on the cloud and is based on Apache Superset which is an open-source software cloud-native application for data exploration and data visualisation being able to handle data at petabyte scale.
Features
Providing visual analytics tools and methods
Support real-time stream data visualisation
Feasibility of receiving input data in various formats and connecting to most of the SQL based data sources through SQLAlchemy
Ability to manage users authentication and data asset permissions
customised visialisation dashboard based on I4Q look and feel
ScreenShots
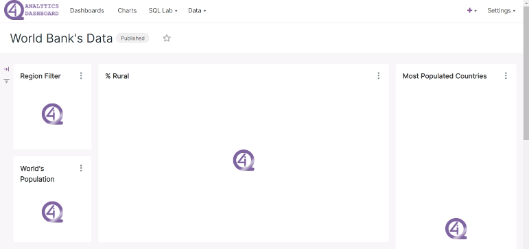
i4Q Dashboard with multiple sample charts

i4Q Dashboard loading charts
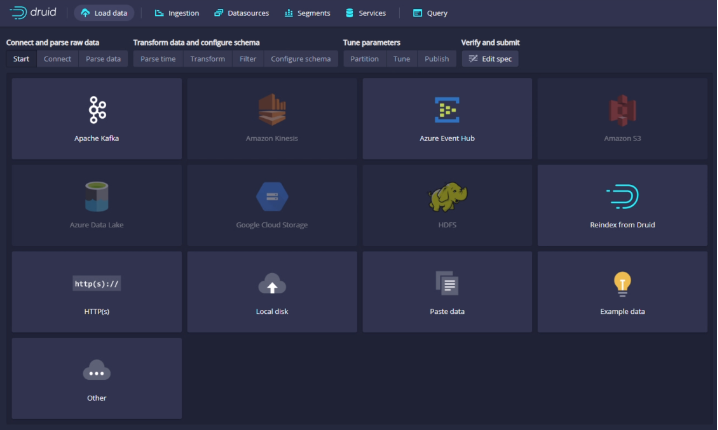
Druid web console
Comercial Information
Authors
Company |
Website |
Logo |
|---|---|---|
KNOWLEDGEBIZ |

|
|
UNINOVA |

|
|
IKERLAN |

|
|
ENGINEERING |

|
|
CERTH |

|
License
Apache License 2.0
Pricing
Subject |
Value |
|---|---|
Payment Model |
One-off |
Price |
0 € |
Associated i4Q Solutions
Required
It can operate without the need for another i4Q solution.
Optional
System Requirements
- Docker and Docker Compose on Linux, Mac OS X, or other Unix-like OS. (Windows is also supported through Windows Subsystem for Linux(WSL)2)
16 GB RAM
4 CPU
Hardware virtualisation support
Installation Guidelines
Resource |
Location |
|---|---|
Last release (v.0.1.0) |
There are two configurations to run i4q dashboard in docker:
1- Run only superset dashboard in docker
Analytics dashboard can be started up without building using a prebuild docker image from Gitlab registry of the project.
Login to Gitlab registry
$ docker login registry.gitlab.com
Pull i4qdashboard docker image. You can pull image with specific tags. Check Registry and container section of project in Gitlab. Below command will pull the latest build of i4qdashboard
$ docker pull registry.gitlab.com/i4q/ad/i4qdashboard:latest
Run i4qdashboard in a container
$ docker run -d -p 8080:8088 --name i4qdashboard registry.gitlab.com/i4q/ad/i4qdashboard:latest
Access UI on localhost:8088
2- Run superset dashboard with kafka and druid services in docker
Login to Gitlab registry
$ docker login registry.gitlab.com
Run the docker compose
$ docker-compose -f docker-druid-kafka.yml up --build -d
Optionally load example datasets and dashboards
$ docker exec -it i4qdashboard superset load-examples
NOTE: consult develop branch here for more options and to build from source
User Manual
This solution is built based on Apache Superset which is an open-source software cloud-native application for data exploration and data visualisation. The latest guidelines and user manual for Apache Superset can be found here: https://superset.apache.org/docs/intro
Data Streaming Configuration
In order to create a data streaming pipeline for visualisation, the Druid is used as the middleware. The latest guidelines of Apache Druid for the pipeline configuration can be found here: https://druid.apache.org/docs/latest/design/index.html