i4Q Infrastructure Monitoring
General Description
The i4QIM Solution provides an ensemble of monitoring tools and predictive failure alerting mechanisms to inform machine operators and other solutions to take corrective actions when a problem is detected. The advanced AI and ML algorithms, developed within the scope of i4QIM, monitor the manufacturing lines and processes and ensure fast and efficient problem prediction mechanisms, while providing alerts before a permanent damage is present. The i4QIM incorporates an ensemble of monitoring tools and predictive failure alerting mechanisms, aiming to provide efficient alerts when a problem is detected. i4QIM monitors manufacturing lines and processes by tracking and analyzing industrial sensor signals. It also monitors the real-time analysis results delivered by other i4Q solutions to provide feedback about machines’ optimal functionality. i4QIM rely on state-of-the-art ML algorithms to detect or predict imminent problems in manufacturing lines. Except for the proactive alerts, i4QIM also provides the parameter configurations of the observations where a failure is estimated to be present. This may support machine operators in any decision-making process that have to take place, regarding parameters reconfigurations in order to prevent permanent machine failures. Moreover, these insights can be also exploited by other i4Q solutions, e.g., i4QLRT solution, in order to take the respective corrective actions, reconfigure machine parameters, and optimize the overall manufacturing process.
The objective of the i4QIM is to eliminate machine malfunctions, permanent damages, and frequent manufacturing operations interruptions (i.e., machine stops). It supports industrial companies to reach autonomous operation in manufacturing environments. Consequently, the production rate can be increased, while waste and cost can be reduced.
The conceptual architecture of i4QIM relies on an extensive literature review study that is related to the recent scientific advances of infrastructure monitoring in industry 4.0, which led also to the following journal submission:
M. Ntemi, S. Paraschos, A. Karakostas, I. Gialampoukidis, S. Vrochidis, I. Kompatsiaris “ Infrastructure monitoring and quality diagnosis in CNC machining: A review.”, CIRP Journal of Manufacturing Science and Technology, Elsevier, 2022 (Accepted).
Main Features
GUI. The i4QIM Solution offers its key features in a user-friendly interface, allowing user interaction and providing insightful visualizations to present the results of the performed analysis. The UI shares a common structure with the i4QDIT and i4QQD, to maintain consistency across all CERTH’s solutions.
Data Import. The user has the option to upload data from several different sources, for static or dynamic data analysis. The user can load CSV data files from local directories, from collections through the MongoDB provided by i4QDR, or from the Message Broker.
Static data analysis. A user that is familiar with machine learning operations can split the loaded data into train/test sets to train a new predictive model or select a pretrained one to evaluate the presence of machine malfunctions.
Dynamic data analysis. A less experienced user with machine learning operations, can use the dedicated operator’s tab to view the analytic results of a pre-trained ML model, that evaluates the machine status in real-time. The results are also automatically stored in the i4QDR for further study.
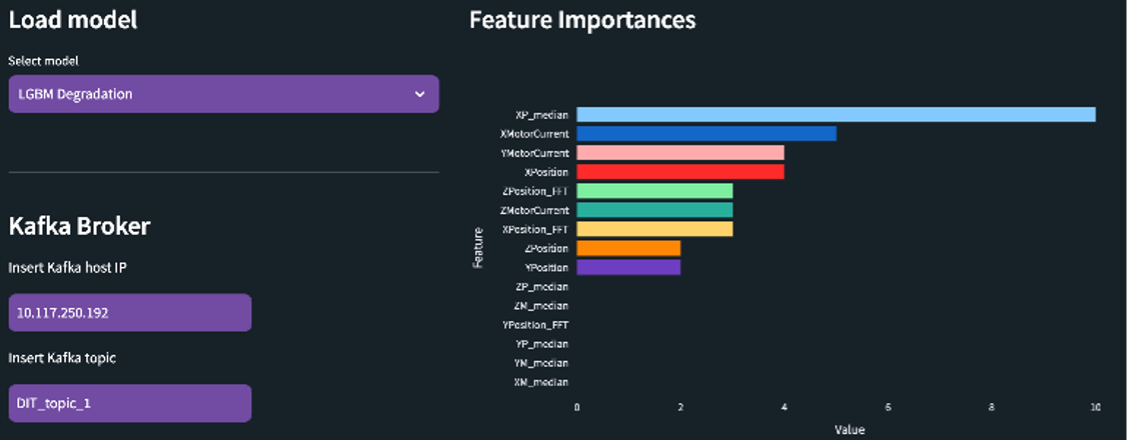
Notifications & Visualizations. Upon the identification of a machine problem, the tool provides an alert, indicating the percentage of samples in which a problem has been detected. Moreover, information about the model’s inner workings is also provided as feature importances. The importance indicates the magnitude of contribution that its feature (sensor) has towards the prediction of the model.
Target Audience
i4QIM can serve the needs of infrastructure personnel regardless of their expertise in machine learning. A data analyst or an engineer can use the static data analysis functionality of the tool, to explore past machine malfunction cases by studying historical data. Also, they can benefit from the option of training new ML models, since the tool can be integrated and adjusted to operate under different machines. On the other hand, the operators can see the live analytics, to have a continuous overview of the machine status and be alerted of any potential failures during their shift.
Comercial information
Authors
Partner |
Role |
Website |
Logo |
|---|---|---|---|
CERTH |
Leader |

|
|
IBM |
Vice-Leader |

|
|
KBZ |
Participant |
|
Technical Specifications
i4QIM is mapped to the Monitor and Diagnostics sub-component of the Platform Tier. The i4QIM solution monitors the health of workloads and the related processes and trigger alerts when a harmful event is estimated to be present. AI and ML models are utilized, which are trained and validated on historical industrial sensor data. It predicts and detects imminent harmful problems and provide alerts along with the respective parameter configurations of the entries which are estimated to be faulty, in order to enable machine operators or other solutions to start their reconfiguration in time, aiming to prevent a complete production line stop. By analysing sensor data and exploiting them to further enhance the performance of the AI and ML models, the i4QIM solution intends to ensure fully autonomous operations in several manufacturing lines and processes.
Platform Tier: The i4QIM mapping to “Data Brokering and Storage” ensures that this solution has access to a wide range of manufacturing data. The rich data sources enable the optimization, fine tuning, and generalization of the predictive models, enhancing the reliability of the alerting system. The i4QIM mapping to “Models Management and Services” enables the real-time monitoring of other i4Q analytical solutions. The meta-analysis of their analytical results and final outputs allows for highly accurate problem detection performances, leading to an efficient, overall infrastructure monitoring. The i4QIM mapping to “Monitor and Diagnostics” sub-component enables this solution to run as a standalone, which can alert in advance other analytical i4Q solutions or human operators to take the required corrective actions when a machine or a process problem has been detected. The concept of the predictive alerting system may decrease significantly defects, ensure avoiding frequent stops of the production lines, and costly repairs arising from permanent failures.
Edge Tier: The i4QIM mapping to “Data Collecting” sub-component enables the solution to gather industrial data directly from sensors installed in the manufacturing lines, to provide real-time problem detection when it runs as a standalone. The i4QIM mapping to “Data Management” sub-component ensures that the solution analyses efficiently the multi-source manufacturing data (i4QDR data, i4QDIT data, sensor data), leading to an optimal fine tuning of the ML models. Feature engineering along with the related feature importance may reveal critical insights about parameter configurations related to the presence of harmful events.
The AI and ML frameworks used in i4QIM have been developed in Python language and they do not have any strict hardware requirements since fast and efficient models have been carefully selected.
Technical Development
This i4Q Solution has the following development requirements:
Development Language: Python >= 3.8
Containerization: Docker, Docker Compose
Deployment/Orchestration: -
User Interface: Streamlit
Database engine: i4QDR - MongoDB
Python libraries: Numpy, Pandas, SciPy, JSON, Scikit Learn
License
The licence is per subscription of 150€ per month.
Pricing
Subject |
Value |
|---|---|
Installation |
110€ (4-8 hours) |
Customisation |
3000€ (approx. 100 hours, depending on the client’s data format, annotated data availability, AI robustness tests) |
Training |
220€ (8-16 hours) |
Associated i4Q Solutions
Required
Not strict dependencies.
Optional
System Requirements
Docker requirements:
4 GB Ram
10 GB Storage (at least 5 GB for the Docker container)
64-bit operating system
Hardware virtualisation support
Installation Guidelines
Resource |
Location |
|---|---|
First release (v1.0.0) |
|
Second release (v2.0.0) |
|
Final Generic Version |
Installation
Decompress the contents of the zip file in a directory.
Include the necessary SSL certificates in the
Certificates/clientfolder to establish a secure connection to the Message Broker (these certificates are generated during the installation of the Message Broker). The required certificates are:
Certificate Authority (PEM file).
Client SSL certificate (PEM file).
Private SSL key (PEM file).
Open a command terminal.
Navigate to the directory where the artefacts have been decompressed from the zip file and locate the solution’s Docker compose file.
Execute the following command to build and run the containers defined in the file.
docker compose up -d
Open a web browser (preferably Google Chrome) and open the URL http://localhost:8502 to access the solution’s web interface.
User Manual
Explanation |
Image |
|---|---|
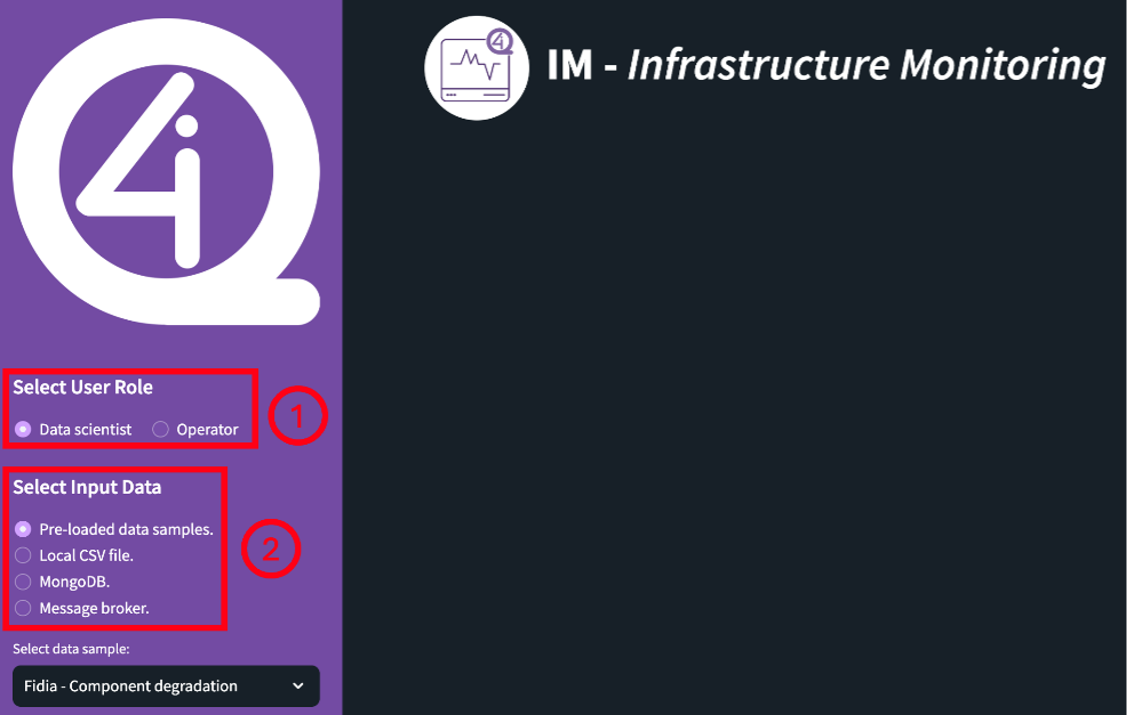
User role selection Based on the expertise of the user, the tool adjusts its functionalities. The data scientist role allows for historical data analysis and the training of new Machine Learning algorithms. On the other hand, the operator role is oriented towards real-time analytics. Data source selection The user can upload data by selecting from a set of different data input options. These options include:
|
|
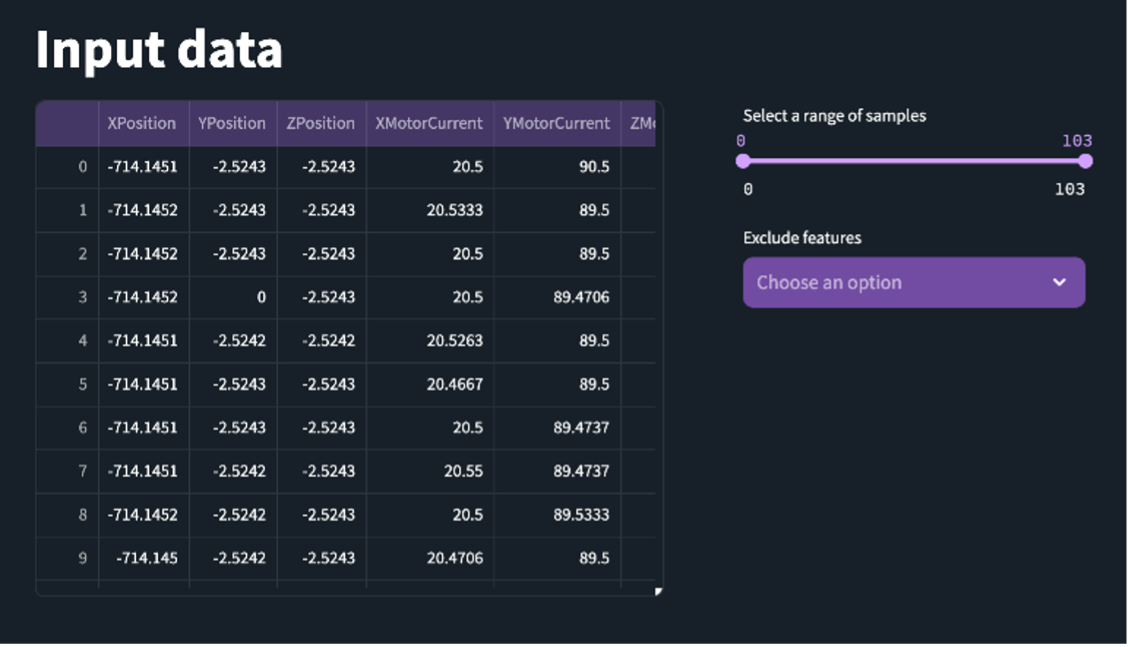
In the Data Scientist tab, once the data has been loaded, a table is presented containing the entirety of the dataset, along with a slider to adjust the number of data samples. |
|
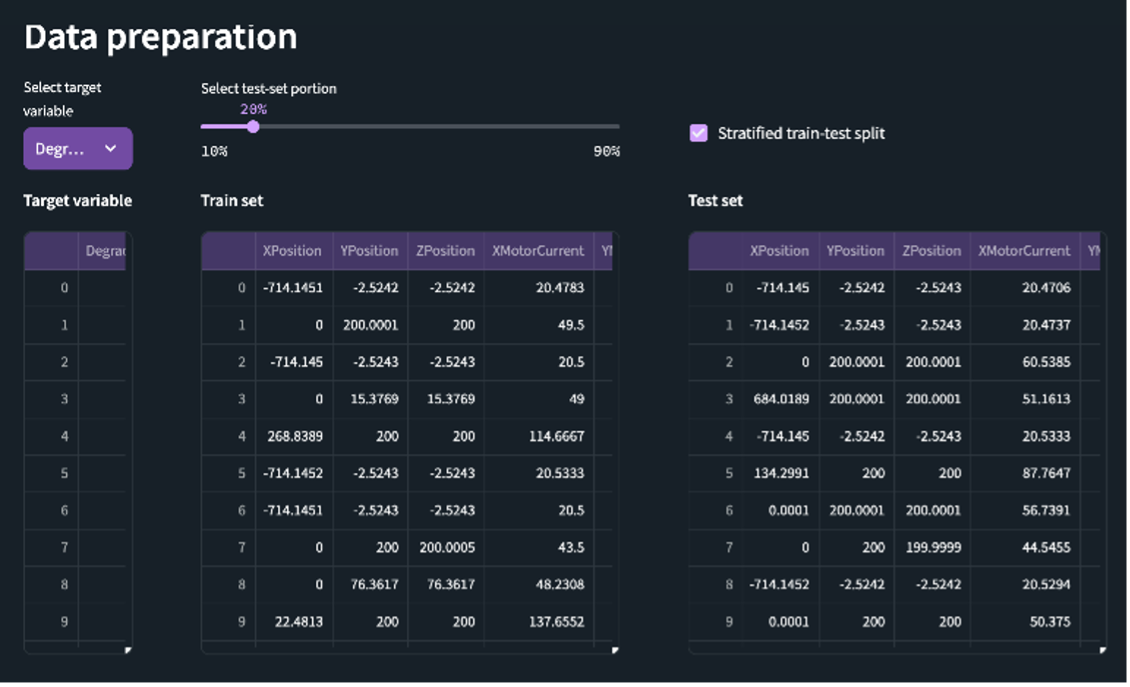
The user can then select the target variable that will be used in the training process of the detection algorithm. Also, an option to adjust the ratio of training and testing data samples is provided with or without the user of a stratified splitting strategy. |
|
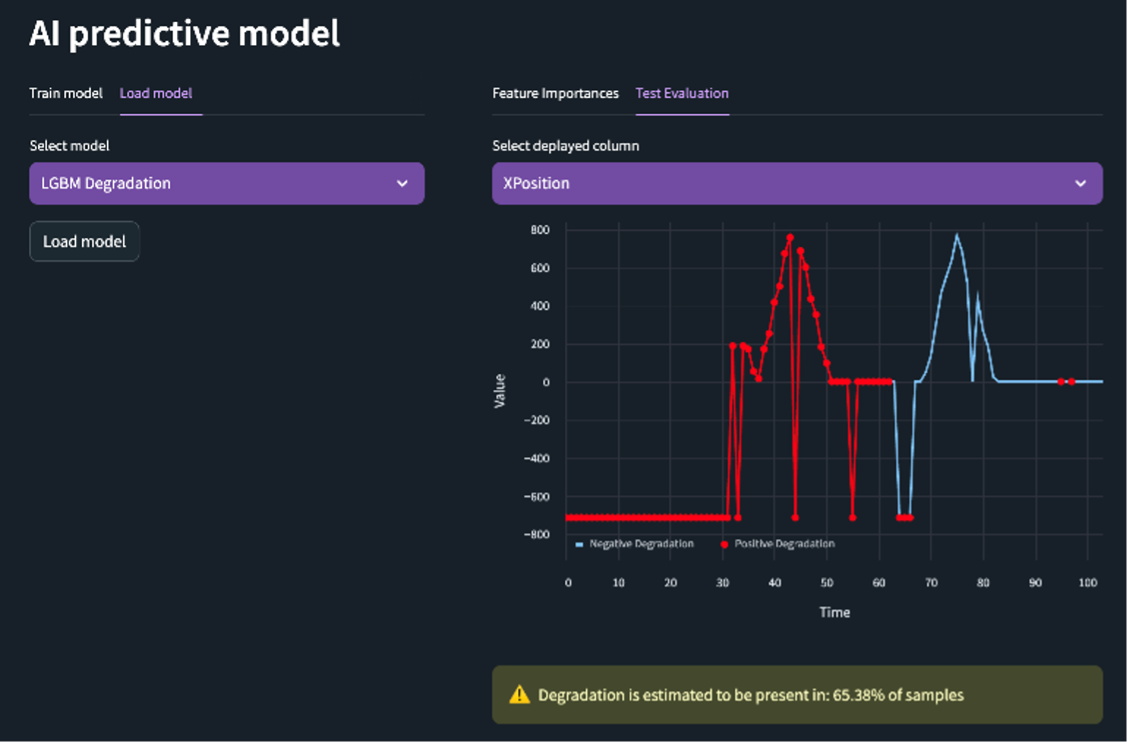
Finally, the user can either choose to train a new AI detection model or select one from the available pre-trained models. Then, the user can observe the samples in which a machine malfunction/degradation has been detected along with the magnitude of contribution that each sensor has towards the predictions of the model. |
|
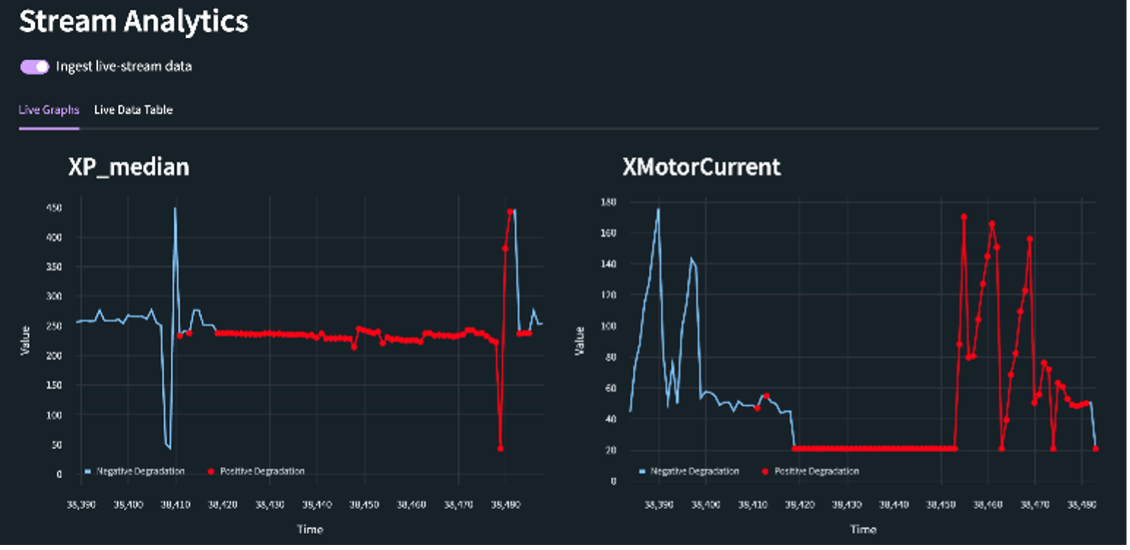
In the Operator’s tab, the use can select one of the pre-trained AI models and specify the Kafka server and topic to ingest real-time machine sensor data into the platform. |
|
By enabling the stream-analytics, the selected predictive model is evaluating the presence of general machine malfunctions or specific component degradation in real-time and presents the results through live charts. |
|